File:Time-domain-plot.png
From openEMS
No higher resolution available.
Time-domain-plot.png (519 × 407 pixels, file size: 14 KB, MIME type: image/png)
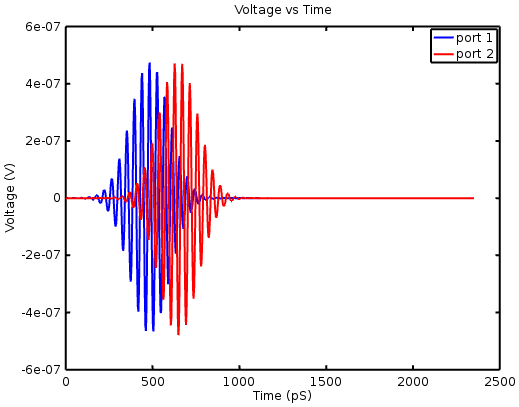
Time-domain plot of the voltages on the two ports in the rectangular waveguide tutorial.
File history
Click on a date/time to view the file as it appeared at that time.
(Latest | Earliest) View (newer 50) (older 50) (20 | 50 | 100 | 250 | 500)| Date/Time | Thumbnail | Dimensions | User | Comment | |
|---|---|---|---|---|---|
| current | 19:49, 15 May 2017 | | 519×407 (14 KB) | BVeidt (Talk | contribs) | (Time-domain plot of the voltages on the two ports in the rectangular waveguide tutorial.) |
- Edit this file using an external application (See the setup instructions for more information)
File links
The following page links to this file:
