Tutorial: Parallel Plate Waveguide
From openEMS
- Download the latest matlab file using Github: Parallel_Plate_Waveguide.m
- Simulation Time: << 1 min
This tutorial shows the simplest possible simulation setup. We will cover
- the octave script
- visualization of the structure
- openEMS output
- visualization of the result
Refer to the included help inside every octave function to know the meaning of the parameters.
Contents |
Octave (Matlab) Simulation Script
To start the script within an empty environment, the first lines are:
close all
clear
clc
To specify the FDTD options, we need the FDTD structure:
FDTD = InitFDTD('NrTS',100, 'EndCriteria',0, 'OverSampling',50);
FDTD = SetSinusExcite(FDTD,10e6);
FDTD = SetBoundaryCond(FDTD,{'PMC' 'PMC' 'PEC' 'PEC' 'MUR' 'MUR'});
The first command inititalizes the FDTD data-structure, setting the number of time steps (NrTS) to 100 with an end criteria of 0. The second command specifies a sinusoidal excitation function (in the time domain) with a frequency of 10 MHz. The third command sets the boundary conditions to model a parallel plate (perfect electric conductor at ymin and ymax). The MUR condition absorbs the propagating wave at zmin and zmax.
Next, the CSXCAD geometric library needs to be initialized:
CSX = InitCSX();
To solve for discrete electromagnetic fields, we need to define a mesh. The default units are metres:
mesh.x = -10:10;
mesh.y = -10:10;
mesh.z = -10:30;
CSX = DefineRectGrid(CSX, 1, mesh);
Lets add the source to our parallel plate waveguide (spatial domain):
CSX = AddExcitation(CSX,'excitation',0,[0 1 0]);
CSX = AddBox(CSX,'excitation',0,[-10 -10 0],[10 10 0]);
We need to define what to observe (here a plane where to record the E-field):
CSX = AddDump(CSX,'Et');
CSX = AddBox(CSX,'Et',0,[-10 0 -10],[10 0 30]);
The final task is to write the FDTD and CSX structure into a xml-file:
mkdir('tmp');
WriteOpenEMS('tmp/tmp.xml',FDTD,CSX);
Visualization of the Structure
To have a look at the geometry we define in the octave script, add:
CSXGeomPlot( 'tmp/tmp.xml' );
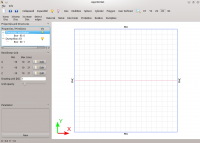
After execution of the script, AppCSXCAD will open automatically. The screenshot shows the xy-plane of our computational area. The excitation box (blue) surrounds the area. The dump box is visible as a red line in the center of the screen (it's an xz-plane).
The structure looks good - let's start the simulation.
OpenEMS Simulation
Add
RunOpenEMS('tmp','tmp.xml','');
and start the script again. Close AppCSXCAD and observe the terminal showing the output of openEMS:
 ----------------------------------------------------------------------
 | openEMS 64bit -- version v0.0.25-18-gc485f04
 | (C) 2010-2012 Thorsten Liebig <thorsten.liebig@gmx.de>  GPL license
 ----------------------------------------------------------------------
	Used external libraries:
		CSXCAD -- Version: v0.2.4-8-g0fb245a
		hdf5   -- Version: 1.8.4
		          compiled against: HDF5 library version: 1.8.4-patch1
		tinyxml -- compiled against: 2.5.3
		fparser
		boost  -- compiled against: 1_46_1
		vtk -- Version: 5.6.1
		       compiled against: 5.6.1
		MPI -- Version: 2.1
		       compiled against: openMPI1.4.3

Create FDTD operator (compressed SSE + multi-threading)
FDTD simulation size: 21x21x41 --> 18081 FDTD cells
FDTD timestep is: 1.92583e-09 s; Nyquist rate: 25 timesteps @1.03851e+07 Hz
Excitation signal length is: 100 timesteps (1.92583e-07s)
Max. number of timesteps: 100 ( --> 1 * Excitation signal length)
Create FDTD engine (compressed SSE + multi-threading)
Running FDTD engine... this may take a while... grab a cup of coffee?!?
Time for 100 iterations with 18081 cells : 0.21277 sec
Speed: 8.49791 MCells/s
use Paraview to visualize the FDTD result...
Visualization of the Result
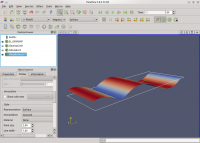
OpenEMS has created some result files in the tmp folder. Start Paraview to visualize the E-field saved by the dump box definition:
- Choose File/Open and select the "Et_..vtr" file.
- Properties -> Apply
- Object Inspector -> Display -> Color by: E-Field
- Animation -> Play
- Rescale to Data Range occasionally to tune the color mapping
- Hint: You may use paraview-filters to improve the visualisation (e.g. a warp-by-vector filter, be sure to apply this as well).
Animation using a Warp-Filter: parallel_plate_waveguide.mp4


